Free Access
Fig. 1
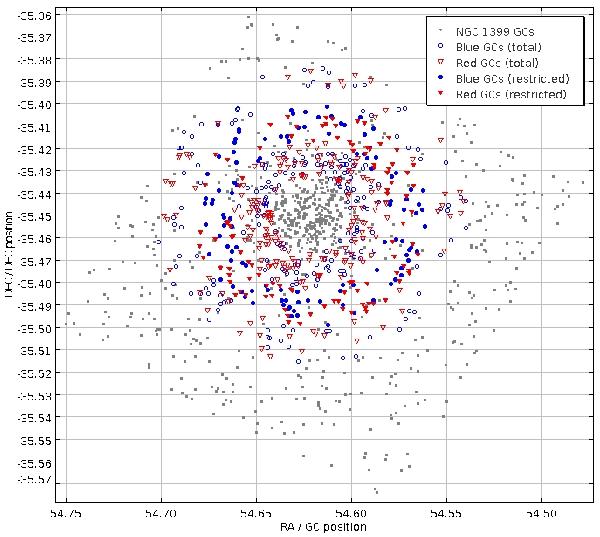
Spatial distribution of the GCs used for the stacking experiments: blue circles and red triangles represent the total blue and red samples with no detected X-ray counterpart in P11. Solid symbols identify the restricted sample. Gray dots represent the rest of the GC system within the HST/ACS mosaic.
Current usage metrics show cumulative count of Article Views (full-text article views including HTML views, PDF and ePub downloads, according to the available data) and Abstracts Views on Vision4Press platform.
Data correspond to usage on the plateform after 2015. The current usage metrics is available 48-96 hours after online publication and is updated daily on week days.
Initial download of the metrics may take a while.