Free Access
Fig. 9
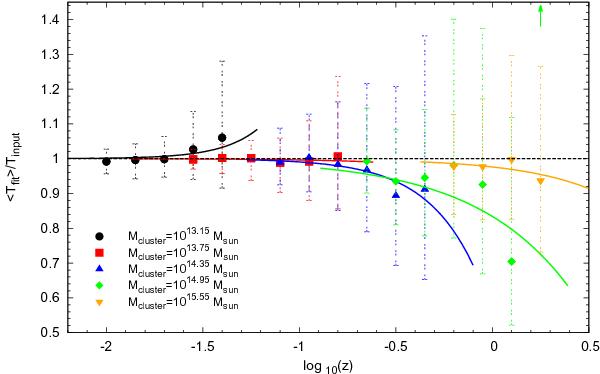
Bias on the best-fit temperature in dependence on the cluster redshift for the simulation of texp = 1.6 ks and known redshift. For each displayed cluster mass individual bias correction functions are suggested as solid curves with the corresponding colour.
Current usage metrics show cumulative count of Article Views (full-text article views including HTML views, PDF and ePub downloads, according to the available data) and Abstracts Views on Vision4Press platform.
Data correspond to usage on the plateform after 2015. The current usage metrics is available 48-96 hours after online publication and is updated daily on week days.
Initial download of the metrics may take a while.