Fig. B.2
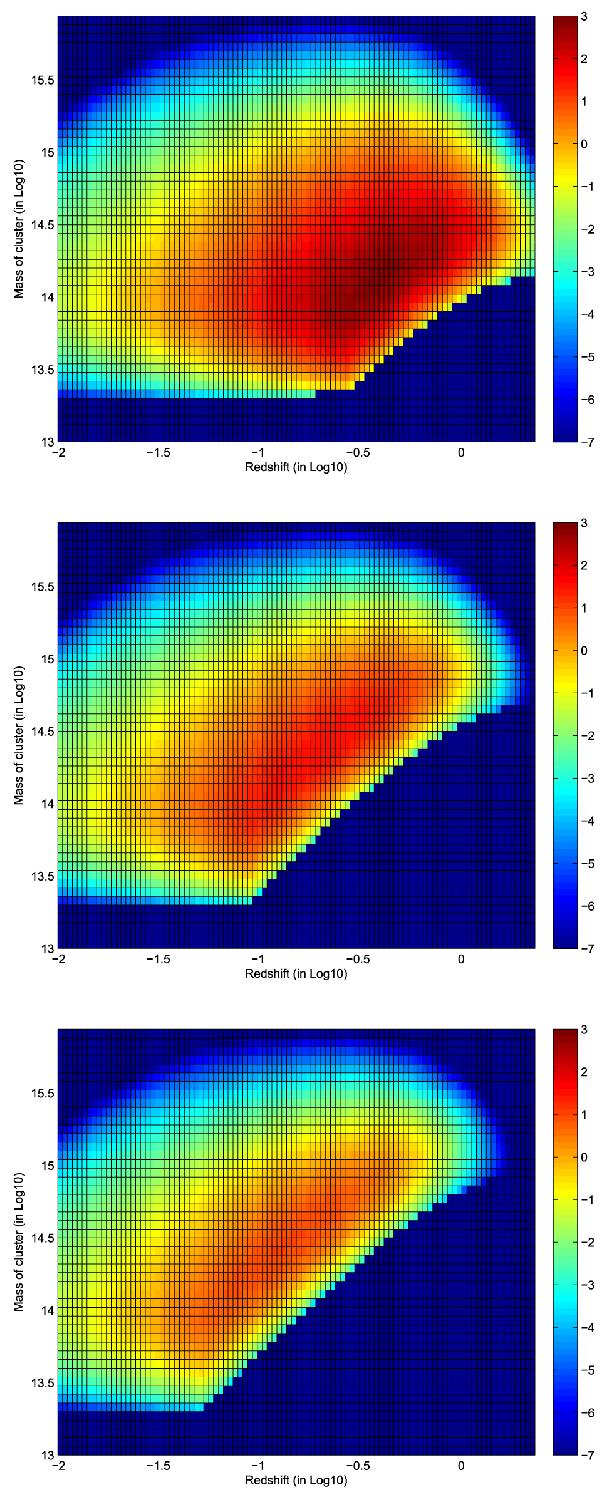
Distribution of galaxy clusters with mass and redshift for three different photon detection minimums ηmin = 50,500 and 1500, when applying the scaling relations by (Vikhlinin et al. 2009a). All plots are generated for a lower mass cut of M = 5 × 10¹³/h100 M⊙ with h100 = 0.70, where the labeling is equivalent to Fig. B.1. The total number of detected clusters reads from top to bottom Ncluster = 103 700, 8900 and 2300.
Current usage metrics show cumulative count of Article Views (full-text article views including HTML views, PDF and ePub downloads, according to the available data) and Abstracts Views on Vision4Press platform.
Data correspond to usage on the plateform after 2015. The current usage metrics is available 48-96 hours after online publication and is updated daily on week days.
Initial download of the metrics may take a while.