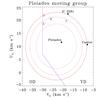
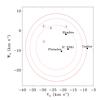
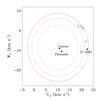
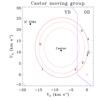
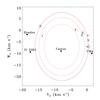
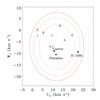
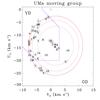
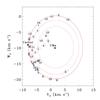
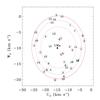
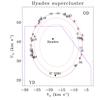
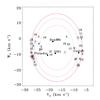
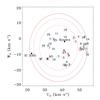
Fig. 8

(U,
V),
(V,
W) and
(U,
W)
planes (from left to right) of all potential candidates
(7%
 %) identified into the non-member
sample. The YD population and the mean velocities of MGs are indicated as in Fig.
7. We displayed those whose probability
P2D is larger than or equal to
40% (hexagons), in the
range 30%–40% (squares) and 20%–30% (diamonds). To visualize the locus
of each source in the 3
kinematic diagrams of studied MGs (from top to bottom), we have
numbered various symbols. We also over-plotted elliptical contours of three
k
values, as in Fig. 7.
%) identified into the non-member
sample. The YD population and the mean velocities of MGs are indicated as in Fig.
7. We displayed those whose probability
P2D is larger than or equal to
40% (hexagons), in the
range 30%–40% (squares) and 20%–30% (diamonds). To visualize the locus
of each source in the 3
kinematic diagrams of studied MGs (from top to bottom), we have
numbered various symbols. We also over-plotted elliptical contours of three
k
values, as in Fig. 7.
Current usage metrics show cumulative count of Article Views (full-text article views including HTML views, PDF and ePub downloads, according to the available data) and Abstracts Views on Vision4Press platform.
Data correspond to usage on the plateform after 2015. The current usage metrics is available 48-96 hours after online publication and is updated daily on week days.
Initial download of the metrics may take a while.