Fig. 6
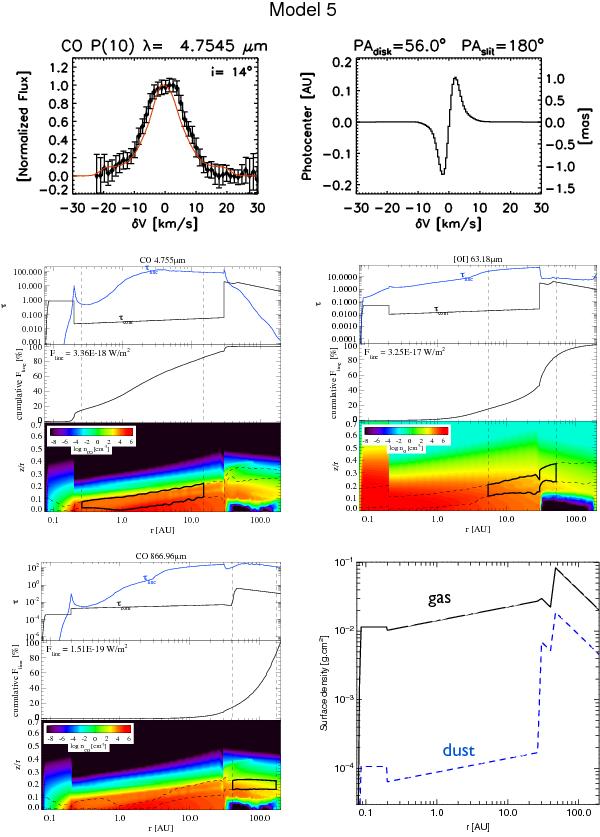
Upper panels: CO P(10) profile (left) and expected spectro-astrometry signature (right) for Model 5. Central panels: optical depth of the line and of the continuum, cumulative line flux, number density, and emitting region diagrams for the CO P(10) (left) and [O i] 63 μm (right) lines. The box in thick black lines represents the region in the disk that emits 70% of the line radially and 70% of the line vertically, thus approximately ~50% of the line flux. Lower panels: (left) similar plots for the 12CO 3−2 line at 870 μm, (right) surface density of the gas (solid black line), and the dust (dashed blue line) as a function of the radius. The line fluxes quoted in the panels are the integrated line fluxes from the whole disk. For the CO P(10) integrated line flux taking the slit losses into account see Table 5. More information about the model is presented in Fig. A.4.
Current usage metrics show cumulative count of Article Views (full-text article views including HTML views, PDF and ePub downloads, according to the available data) and Abstracts Views on Vision4Press platform.
Data correspond to usage on the plateform after 2015. The current usage metrics is available 48-96 hours after online publication and is updated daily on week days.
Initial download of the metrics may take a while.