Fig. A.4
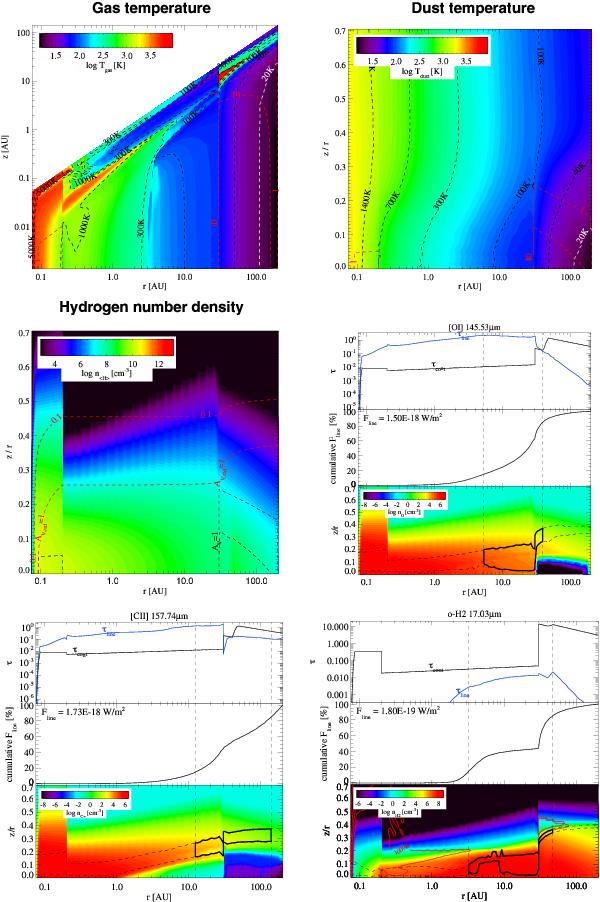
Model 5. Upper panels: (left) gas temperature, (right) dust temperature. Central panels: (left) hydrogen number density, (right) optical depth of the line (τline), of the continuum (τcont), cumulative vertical flux, and number density as a function of the radius for the [O i] line at 145 μm. The box in thick black lines represents the region in the disk that emits 70% of the line radially and 70% of the line vertically, thus approximately ~50% of the line flux. Lower panels: similar plots for the [C ii] line at 157 μm (left) and the ortho H2 0−0 S(1) at 17 μm (right).
Current usage metrics show cumulative count of Article Views (full-text article views including HTML views, PDF and ePub downloads, according to the available data) and Abstracts Views on Vision4Press platform.
Data correspond to usage on the plateform after 2015. The current usage metrics is available 48-96 hours after online publication and is updated daily on week days.
Initial download of the metrics may take a while.