Fig. 9
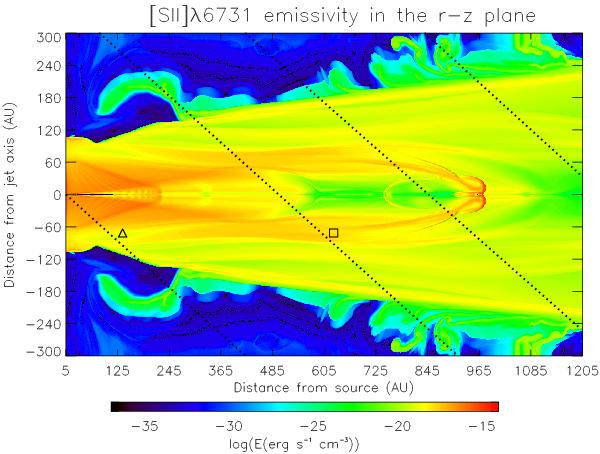
Emissivity map for the unsteady DG4 (μ = −0.5) case. The dotted line marked with a triangle indicates the integration path along the line of sight, whose angle with the jet axis is 38°. The lines marked with a square, at ~4 arcsec from the source, shows the position of the head of the second blob.
Current usage metrics show cumulative count of Article Views (full-text article views including HTML views, PDF and ePub downloads, according to the available data) and Abstracts Views on Vision4Press platform.
Data correspond to usage on the plateform after 2015. The current usage metrics is available 48-96 hours after online publication and is updated daily on week days.
Initial download of the metrics may take a while.