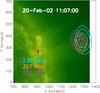
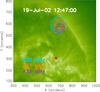
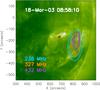
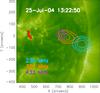
Fig. 7
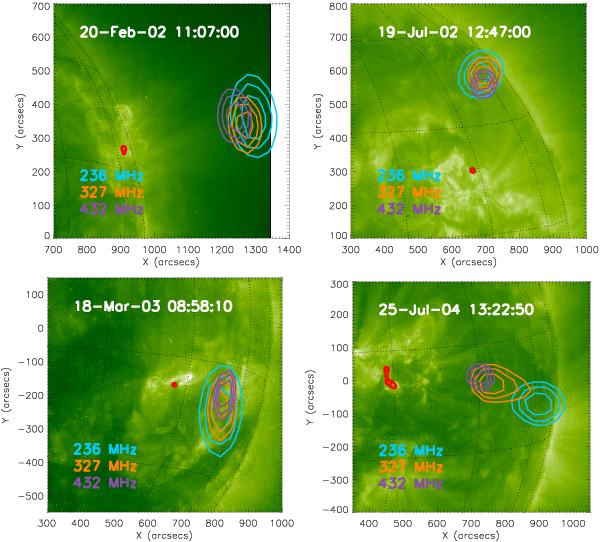
Four flares that showed simple morphologies in the radio wavelength during the course of the type III bursts. The flare is imaged in EUV 195 Å by EIT. At the base of the loops there are the RHESSI 12–25 keV X-rays (red) integrated over the entire event. Higher in the corona there are the NRH 432 MHz (purple), 327 MHz (orange), and 237 MHz (blue) integrated over 10 s during the events where the start of this integration is indicated on each image. All contours are at 10% intervals starting from 70 percent.
Current usage metrics show cumulative count of Article Views (full-text article views including HTML views, PDF and ePub downloads, according to the available data) and Abstracts Views on Vision4Press platform.
Data correspond to usage on the plateform after 2015. The current usage metrics is available 48-96 hours after online publication and is updated daily on week days.
Initial download of the metrics may take a while.