Free Access
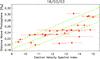
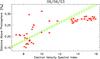
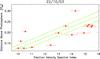
Fig. 5
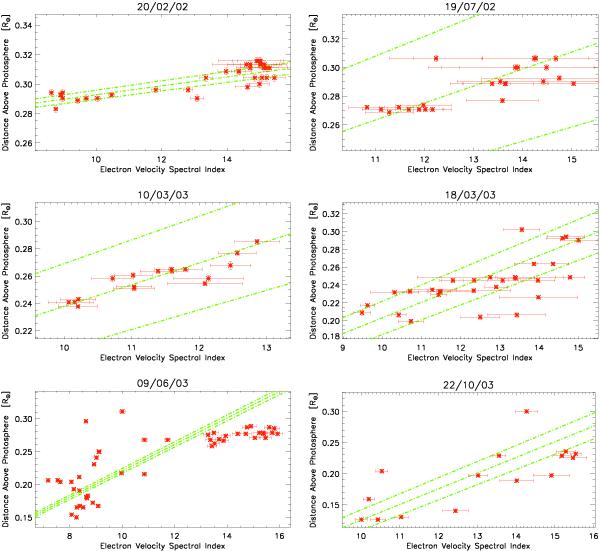
Starting heights of the groups of type III bursts plotted against the electron velocity spectral index for the events shown in Fig. 3. The central dashed line shows the linear fit to the data with the outer dashed lines showing the one-sigma extremes of the fit.
This figure is made of several images, please see below:
Current usage metrics show cumulative count of Article Views (full-text article views including HTML views, PDF and ePub downloads, according to the available data) and Abstracts Views on Vision4Press platform.
Data correspond to usage on the plateform after 2015. The current usage metrics is available 48-96 hours after online publication and is updated daily on week days.
Initial download of the metrics may take a while.