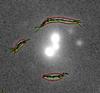
Fig. A.1
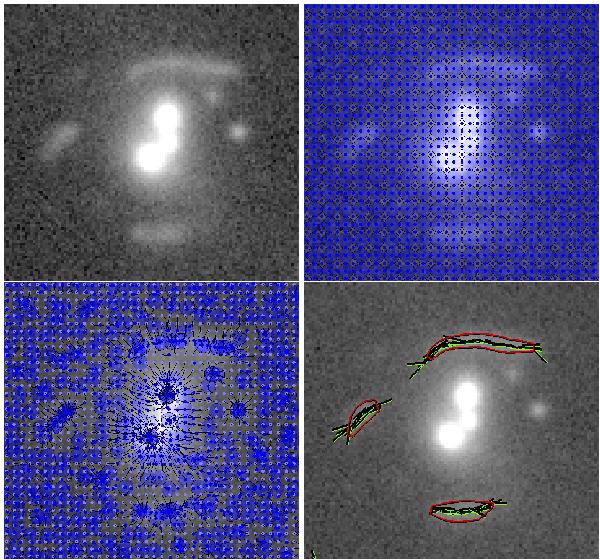
Top-left: I-band SL2S J02140-0535 observation, also featuring a giant arc. Top-right: regular grid of disk-shaped areas providing the initial condition of the displacement iterations. Only every second row and column of areas are shown. Bottom-left: areas after three iterations, each moving them to their centre of brightness, and the path they traced. Bottom-right: local orientations for each area, determined using the second-brightness moments. Lines corresponding to coherent areas are highlighted. The red contours show the segmentation of the objects.
Current usage metrics show cumulative count of Article Views (full-text article views including HTML views, PDF and ePub downloads, according to the available data) and Abstracts Views on Vision4Press platform.
Data correspond to usage on the plateform after 2015. The current usage metrics is available 48-96 hours after online publication and is updated daily on week days.
Initial download of the metrics may take a while.