Fig. 5
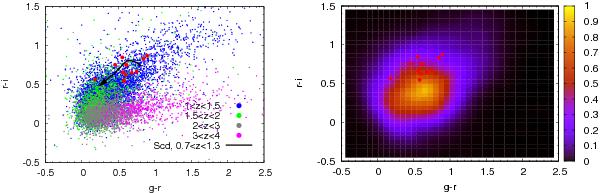
Left panel: colour–colour diagram for previously known arcs in red and a sub-sample of galaxies observed in the COSMOS field subdivided in redshift bins. The red points denote the arcs previously known in the survey that were used to calibrate the colour selection. The small colour region with arcs shows were the lensed sources lie at redshift z ≈ 1 (as predicted by our optical depth model) and have well-defined colour properties (as shown by the black arrow referring to a Scd galaxy, for which we derived the photometry out of a synthetic SED; here the arrowhead points in the direction of increasing redshifts). Right panel: same colour–colour diagram, but for all objects detected by the arcfinder.
Current usage metrics show cumulative count of Article Views (full-text article views including HTML views, PDF and ePub downloads, according to the available data) and Abstracts Views on Vision4Press platform.
Data correspond to usage on the plateform after 2015. The current usage metrics is available 48-96 hours after online publication and is updated daily on week days.
Initial download of the metrics may take a while.