Fig. 4
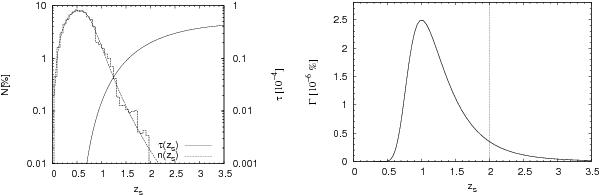
Left panel: lensing optical depth, τd, based on NFW haloes following the differential mass function of Sheth & Tormen (2002), together with the actual data and best fit of the CARS source redshift distribution, n(zs). Right panel: redshift distribution of the expected number density of arcs, Γd, based on the best fit of the sources’ redshift distribution. Note that the best fit of the source distribution used in this model overestimates the actual counts, which drop for z> 1.3 and vanish at z ≈ 2, thus suppressing the high-redshift tail of Γd. The vertical line marks the redshift limit of the observable sources.
Current usage metrics show cumulative count of Article Views (full-text article views including HTML views, PDF and ePub downloads, according to the available data) and Abstracts Views on Vision4Press platform.
Data correspond to usage on the plateform after 2015. The current usage metrics is available 48-96 hours after online publication and is updated daily on week days.
Initial download of the metrics may take a while.