Fig. 3
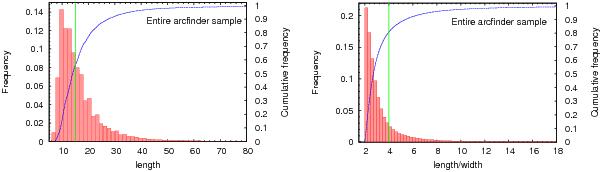
Probability distribution (filled bars) and cumulative function (blue line) of the length, expressed in pixels of 0.186 arcsec in size, and the length-to-width ratio of all objects detected with the arcfinder before the application of the final geometrical and colour selection, in the left and right panels, respectively. The vertical green lines represent the respective lower limits adopted for the final candidate selection to maximize the completeness given the limits imposed by the data PSF.
Current usage metrics show cumulative count of Article Views (full-text article views including HTML views, PDF and ePub downloads, according to the available data) and Abstracts Views on Vision4Press platform.
Data correspond to usage on the plateform after 2015. The current usage metrics is available 48-96 hours after online publication and is updated daily on week days.
Initial download of the metrics may take a while.