Fig. 2
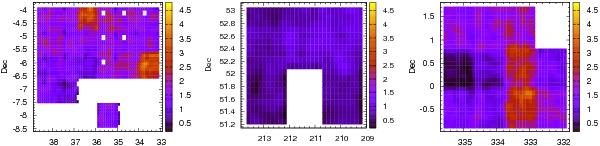
Number density per arcmin2 of all objects identified by the arcfinder before applying geometrical and colour-selection criteria, which were applied in subsequent steps to identify the arc candidates. Since the more stringent constraints are not applied yet, these maps are dominated by spurious detections, which shows their distribution in the survey. The fluctuations in number density are expected because of the intrinsic inhomogeneous distribution of the sources and the large inhomogeneities of the image depth across the survey. We took this into account by measuring the noise locally. The three CARS fields, W1 (left), W3 (middle) and W4 (right), are shown.
Current usage metrics show cumulative count of Article Views (full-text article views including HTML views, PDF and ePub downloads, according to the available data) and Abstracts Views on Vision4Press platform.
Data correspond to usage on the plateform after 2015. The current usage metrics is available 48-96 hours after online publication and is updated daily on week days.
Initial download of the metrics may take a while.