Fig. 7
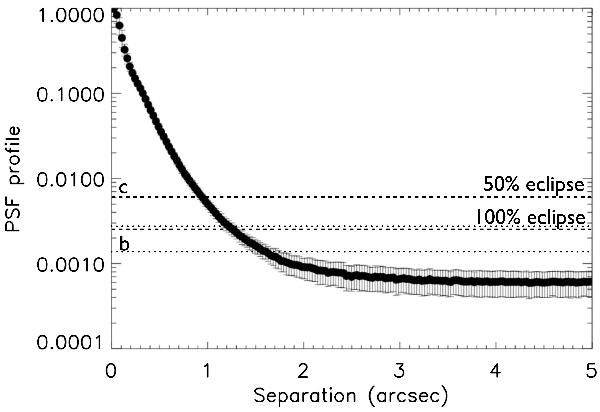
Normalised PSF profile around CoRoT-24, from a VLT/NACO combined image. The horizontal lines delimit the flux level that a contaminant included in the CoRoT ’s PSF should reach in order to produce the observed diluted transit depth. Two lines are plotted, for an unrealistic contaminant completely disappearing during eclipse (100% eclipse line), and a 50% eclipse. Dashed line is for CoRoT-24c, while dotted line is for CoRoT-24b. Realistic potential background eclipsing binaries should lie closer than 1.3′′ and 0.9′′ to the main star to explain the transit depths of CoRoT-24b and c, respectively.
Current usage metrics show cumulative count of Article Views (full-text article views including HTML views, PDF and ePub downloads, according to the available data) and Abstracts Views on Vision4Press platform.
Data correspond to usage on the plateform after 2015. The current usage metrics is available 48-96 hours after online publication and is updated daily on week days.
Initial download of the metrics may take a while.