Fig. 2
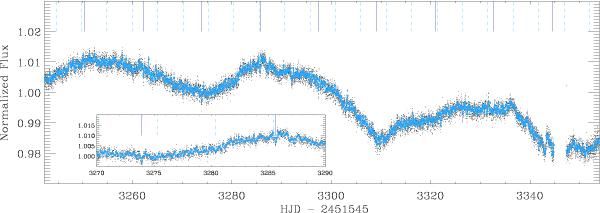
Filtered light curve of CoRoT-24. The black dots are the 512 s sampled data, while the blue curve has been combined in 1 h bins only for display purposes. The inset shows a zoom, where individual transits can barely be detected. The vertical lines show the positions of the transits of CoRoT-24b (dashed light blue) and CoRoT-24c (solid dark blue).
Current usage metrics show cumulative count of Article Views (full-text article views including HTML views, PDF and ePub downloads, according to the available data) and Abstracts Views on Vision4Press platform.
Data correspond to usage on the plateform after 2015. The current usage metrics is available 48-96 hours after online publication and is updated daily on week days.
Initial download of the metrics may take a while.