Fig. 13
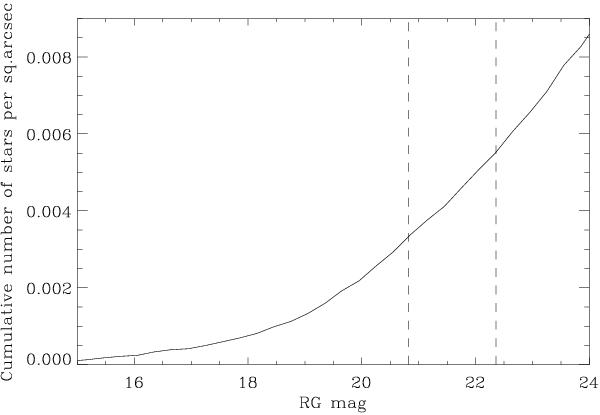
Cumulative number of stars per square arcsec, computed from a combined image of the field of CoRoT-24 that is complete down to RG ~25. The two vertical lines correspond to the extremes of the horizontal lines in Fig. 7, i.e., the highest magnitude a star could have in order to reproduce the observed transit depth of CoRoT-24b while completely disappearing during eclipses, and the magnitude of a star with 50% eclipses needed to explain the transit depth of CoRoT-24c.
Current usage metrics show cumulative count of Article Views (full-text article views including HTML views, PDF and ePub downloads, according to the available data) and Abstracts Views on Vision4Press platform.
Data correspond to usage on the plateform after 2015. The current usage metrics is available 48-96 hours after online publication and is updated daily on week days.
Initial download of the metrics may take a while.