Fig. 8
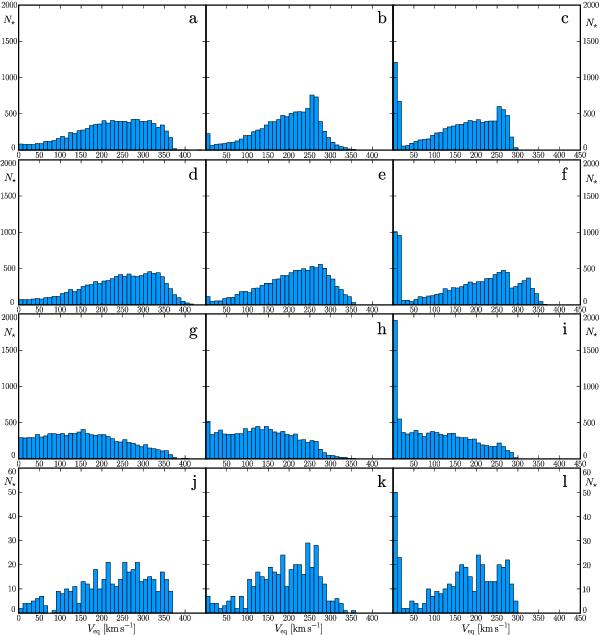
Distribution of surface equatorial velocities in a cluster at three different ages (first column: 10 Myr, second column: 100 Myr, and third column: 1 Gyr). Top row (panels a), b), c)): Z⊙ cluster with the initial velocity distribution from Huang et al. (2010, see their Fig. 6). Second row (panels d), e), f)): same as above, but at Z = 0.002. Third row (panels g), h), i)): same as top row, but with the initial velocity distribution from Huang & Gies (2006). Bottom row (panels j), k), l)): same as top row but for a total number of stars of 400 instead of 10 000.
Current usage metrics show cumulative count of Article Views (full-text article views including HTML views, PDF and ePub downloads, according to the available data) and Abstracts Views on Vision4Press platform.
Data correspond to usage on the plateform after 2015. The current usage metrics is available 48-96 hours after online publication and is updated daily on week days.
Initial download of the metrics may take a while.