Free Access
Fig. 10
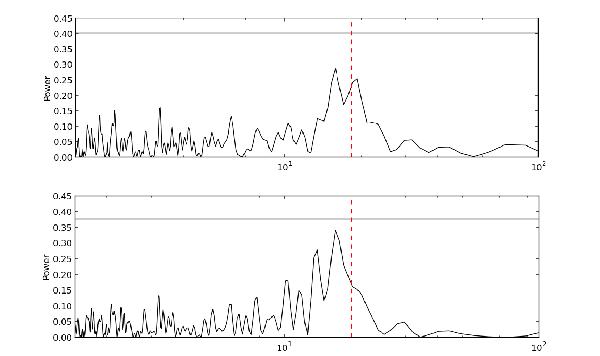
Periodograms of the residuals of the harmonics fit described in Sect. 3.6.1, making use of the RV (top) and FWHM (bottom) to fix the period used to subtract the RV signal and its harmonics. The dashed line indicates the position of the 18.36 day period. The horizontal line represents the 1% FAP.
This figure is made of several images, please see below:
Current usage metrics show cumulative count of Article Views (full-text article views including HTML views, PDF and ePub downloads, according to the available data) and Abstracts Views on Vision4Press platform.
Data correspond to usage on the plateform after 2015. The current usage metrics is available 48-96 hours after online publication and is updated daily on week days.
Initial download of the metrics may take a while.