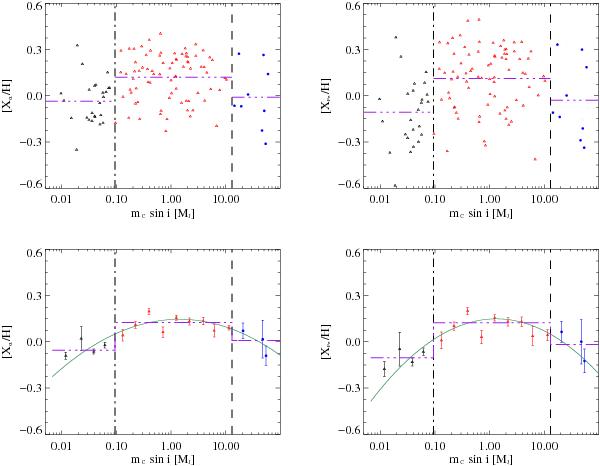
Fig. 8

Abundance ratios [Xα/ H] and [XFe/H] versus minimum mass of the most massive companion mC sin i of α-elements (top-left panel) and iron-peak elements (top-right panel), for stars with small planets (black empty triangles), with giant planets (red empty triangles), with confirmed BD companions (blue filled circles). The average values are shown as violet three-dotted-dashed lines. Lower panels show the mean abundances of stars with small and giant planets, and confirmed BD companions, in equal-sized bins appropriated for the logarithmic scale of companion masses as in Fig. B.4. Error bars represents the standard deviation of the mean divided by the square root of the number of stars in each bin. The green solid line depicts the parabolic fit of the data, whereas the violet three-dotted-dashed lines show the zero-order fits.
Current usage metrics show cumulative count of Article Views (full-text article views including HTML views, PDF and ePub downloads, according to the available data) and Abstracts Views on Vision4Press platform.
Data correspond to usage on the plateform after 2015. The current usage metrics is available 48-96 hours after online publication and is updated daily on week days.
Initial download of the metrics may take a while.


