Fig. 2
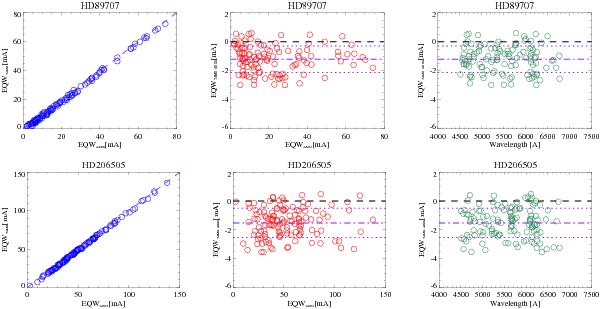
ARES versus TAME graphics for the stars HD 89707 (S/N ~ 110) and HD 206505 (S/N ~ 70). Left panels: EW measured with TAME versus ARES. The 1:1 correspondence is shown as a dashed line. EW differences, EWTAME − EWARES, versus EWARES (middle panels) and spectral line wavelength (right panels). Dash-dotted lines define the mean value of the data points, and dotted lines define the mean plus the standard deviation.
Current usage metrics show cumulative count of Article Views (full-text article views including HTML views, PDF and ePub downloads, according to the available data) and Abstracts Views on Vision4Press platform.
Data correspond to usage on the plateform after 2015. The current usage metrics is available 48-96 hours after online publication and is updated daily on week days.
Initial download of the metrics may take a while.