Fig. 5
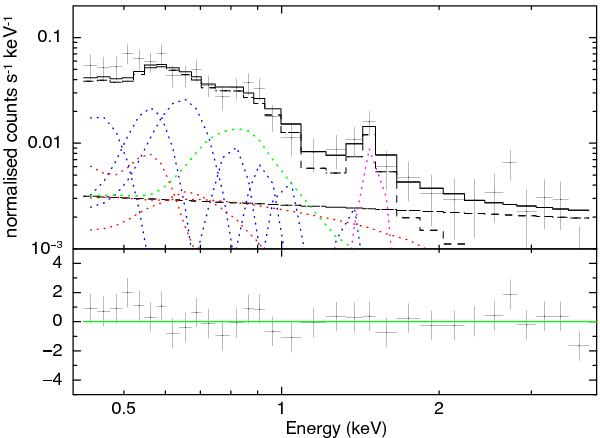
Fit to the EPIC-PN spectrum of the central diffuse emission in NGC 1512. Additive model components are indicated with APB in red, fluorescence line in magenta, SWCX lines in blue, and source emission in green. Results of the source component are presented in Table 4. The dashed black line that follows the data more closely represents the combined additive model, while the straight dashed black line represents the residual SP contamination. The addition of these two provides the total model indicated by the solid black line.
Current usage metrics show cumulative count of Article Views (full-text article views including HTML views, PDF and ePub downloads, according to the available data) and Abstracts Views on Vision4Press platform.
Data correspond to usage on the plateform after 2015. The current usage metrics is available 48-96 hours after online publication and is updated daily on week days.
Initial download of the metrics may take a while.