Fig. 4
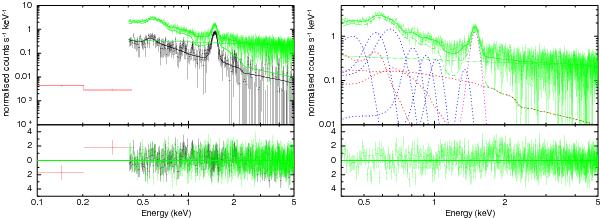
Left: various background spectra considered for our analysis. The black lines indicate the background field spectrum that was fitted simultaneously with the RASS background (shown in red) to constrain the emission components <0.5 keV. This model was then used to fit the NGC 1512/1510 observational background (shown in green for comparison), which required additional components for SWCX contamination. Right: NGC 1512/1510 observational background. Additional model components are indicated with APB in red, fluorescence line in magenta, and SWCX lines in blue. The dashed green line that follows the data more closely represents the combined additive model, while the straight black dashed line represents the residual SP contamination. The addition of these two provides the total model indicated by the solid green line. In each panel, only EPIC-PN spectra are shown for clarity.
Current usage metrics show cumulative count of Article Views (full-text article views including HTML views, PDF and ePub downloads, according to the available data) and Abstracts Views on Vision4Press platform.
Data correspond to usage on the plateform after 2015. The current usage metrics is available 48-96 hours after online publication and is updated daily on week days.
Initial download of the metrics may take a while.