Fig. 2
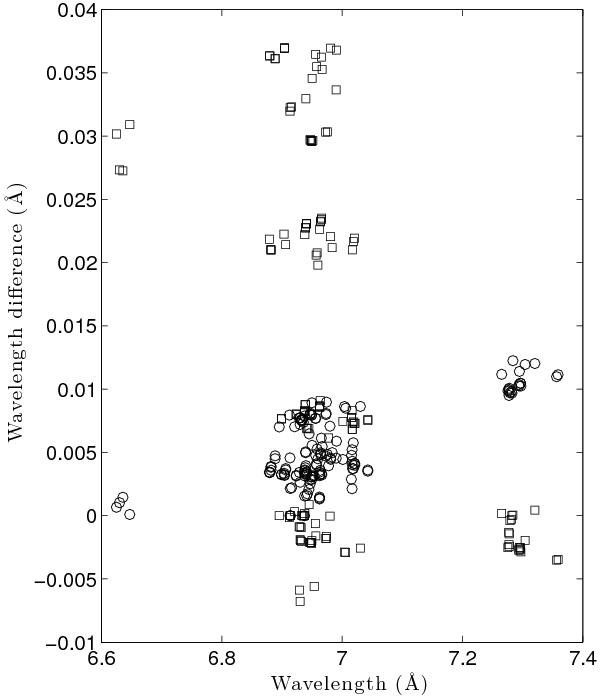
Wavelength differences between our FAC calculations, HFR1 results, and the results from the MCDF method. The wavelength differences are plotted versus FAC6 wavelengths in Å for Si ix. Diamonds: FAC1 with HFR1 (Palmeri et al. 2008). Circles: FAC6 with HFR1 (Palmeri et al. 2008). Squares: FAC6 with MCDF method (Chen et al. 1997).
Current usage metrics show cumulative count of Article Views (full-text article views including HTML views, PDF and ePub downloads, according to the available data) and Abstracts Views on Vision4Press platform.
Data correspond to usage on the plateform after 2015. The current usage metrics is available 48-96 hours after online publication and is updated daily on week days.
Initial download of the metrics may take a while.