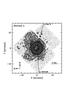
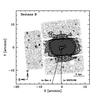
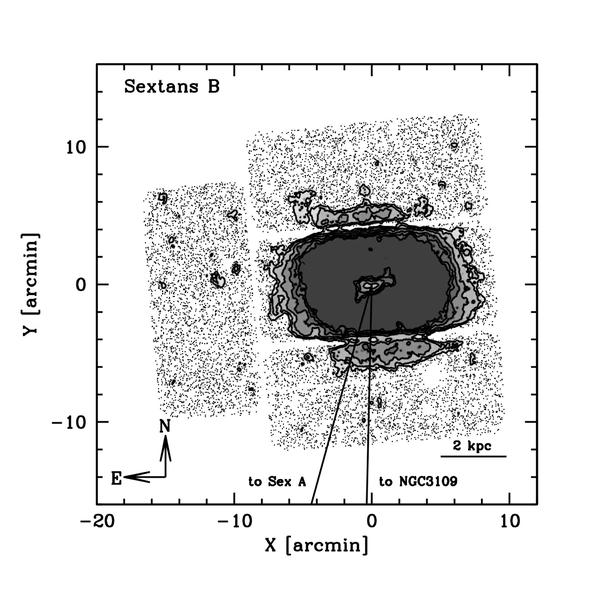
Fig. 8

Stellar surface density contour maps from RGB counts. The contours/levels of grey correspond to a density of 3, 5, 10, 20, and 40σ above the background, from the lightest to the darkest shade of grey. The density depressions near the centre of the main galactic bodies are due to the low degree of completeness in the very crowded innermost regions. The directions to nearby galaxies of the NGC 3109 group are plotted as continuous lines. The distances to NGC 3109 are ~500 kpc and ~700 kpc, for Sex A and Sex B, respectively; the distance between Sex A and Sex B is ~250 kpc. All RGB stars are also plotted (as dots) to provide a direct illustration of the effects of the footprint of the camera and/or heavily saturated foreground stars.
Current usage metrics show cumulative count of Article Views (full-text article views including HTML views, PDF and ePub downloads, according to the available data) and Abstracts Views on Vision4Press platform.
Data correspond to usage on the plateform after 2015. The current usage metrics is available 48-96 hours after online publication and is updated daily on week days.
Initial download of the metrics may take a while.