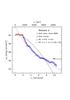
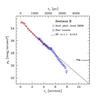
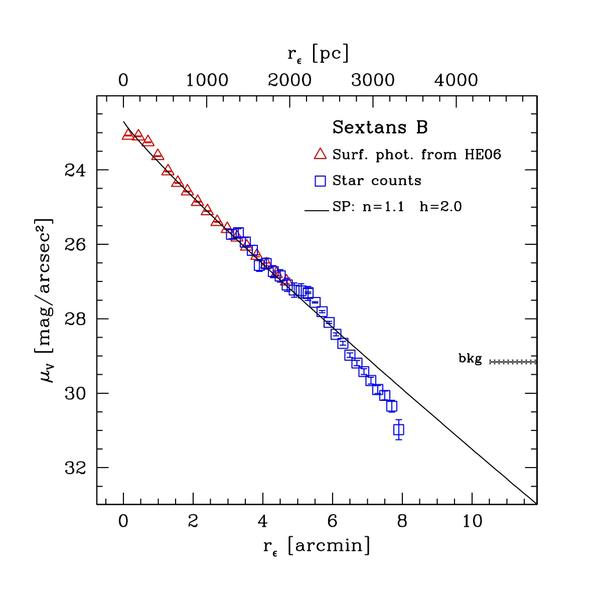
Fig. 7

Surface brightness profiles of Sex A (upper panel) and Sex B (lower panel) in V band obtained by joining surface photometry from HE06 (open triangles) and star counts (open squares) profiles. The continuous lines are the Sérsic models that best fit the profiles. The dashed line in the upper panel is the Sérsic model that best fits the observed profile for Rϵ> 1.8′, i.e, excluding the flat portion of the profile near the centre of the galaxy. The level of the background (bkg) and the associated uncertainty are also shown.
Current usage metrics show cumulative count of Article Views (full-text article views including HTML views, PDF and ePub downloads, according to the available data) and Abstracts Views on Vision4Press platform.
Data correspond to usage on the plateform after 2015. The current usage metrics is available 48-96 hours after online publication and is updated daily on week days.
Initial download of the metrics may take a while.