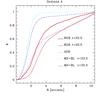
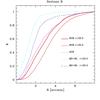
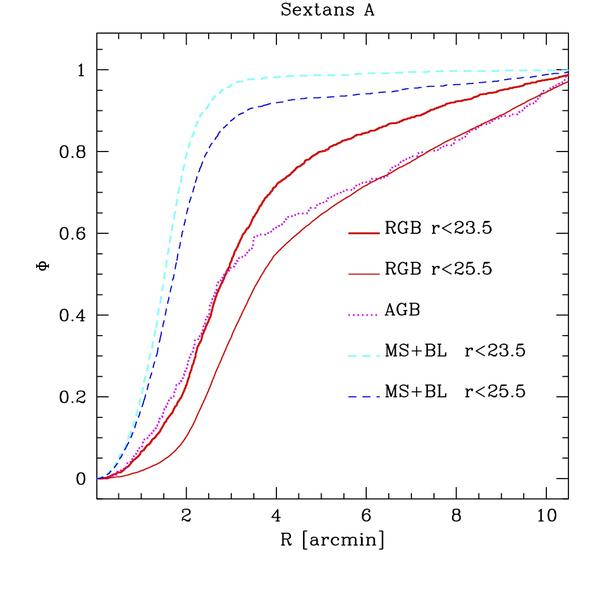
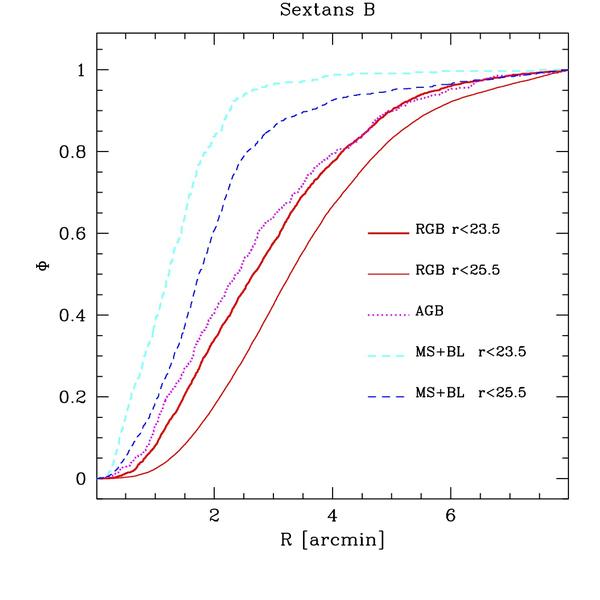
Fig. 6

Cumulative radial distribution of different stellar species, selected according to Fig. 5, for Sex A (upper panel) and Sex B (lower panel). Since this is a comparison between different populations within the same galaxy, for simplicity we consider the distributions in the circular radius R.
Current usage metrics show cumulative count of Article Views (full-text article views including HTML views, PDF and ePub downloads, according to the available data) and Abstracts Views on Vision4Press platform.
Data correspond to usage on the plateform after 2015. The current usage metrics is available 48-96 hours after online publication and is updated daily on week days.
Initial download of the metrics may take a while.