Fig. 4
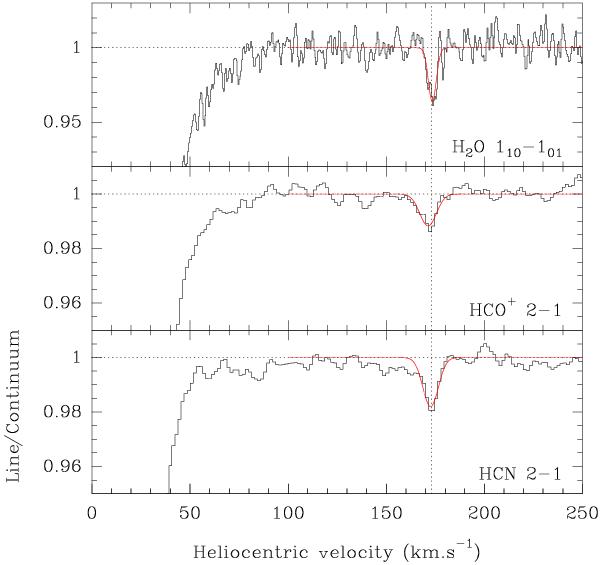
Spectra of the H2O, HCO+, and HCN lines toward the SW image, showing the v = + 170 km s-1 velocity component besides the broad and deep feature at v ~ 0 km s-1. The red curve shows a Gaussian fit of the line, with parameters given in Table 4.
Current usage metrics show cumulative count of Article Views (full-text article views including HTML views, PDF and ePub downloads, according to the available data) and Abstracts Views on Vision4Press platform.
Data correspond to usage on the plateform after 2015. The current usage metrics is available 48-96 hours after online publication and is updated daily on week days.
Initial download of the metrics may take a while.