Fig. 3
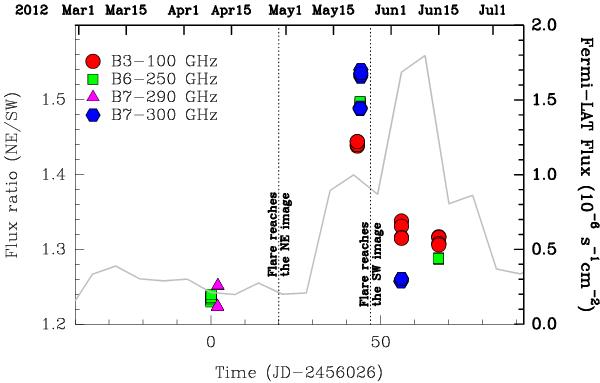
Evolution of the flux ratio ℜ between the NE and SW images of PKS 1830−211(marked symbols for each spectral window in our ALMA observations), overlaid over the γ-ray light curve (in grey) retrieved from the Fermi-LAT public archive. The dotted lines mark the time when the submillimeter flare begins to be seen in each image, according to the model by Martí-Vidal et al. (2013).
Current usage metrics show cumulative count of Article Views (full-text article views including HTML views, PDF and ePub downloads, according to the available data) and Abstracts Views on Vision4Press platform.
Data correspond to usage on the plateform after 2015. The current usage metrics is available 48-96 hours after online publication and is updated daily on week days.
Initial download of the metrics may take a while.