Fig. 2
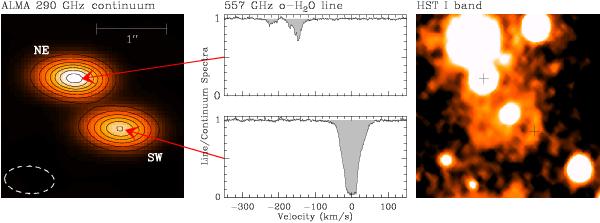
Map of the 290 GHz continuum emission of PKS 1830−211, showing the two resolved lensed images of the blazar (left, contour levels every 0.1 Jy/beam, with the synthesized beam indicated as the dashed ellipse in the bottom left corner) and spectra of the fundamental 557 GHz transition of ortho-water extracted toward each line-of-sight (middle, normalized to the continuum level of each lensed image). An I-band image obtained with the Hubble Space Telescope, revealing the foreground z = 0.89 spiral galaxy, is also shown (right) with the same angular scale as the left panel. The two crosses indicate the position of the blazar images.
Current usage metrics show cumulative count of Article Views (full-text article views including HTML views, PDF and ePub downloads, according to the available data) and Abstracts Views on Vision4Press platform.
Data correspond to usage on the plateform after 2015. The current usage metrics is available 48-96 hours after online publication and is updated daily on week days.
Initial download of the metrics may take a while.