Free Access
Fig. 10
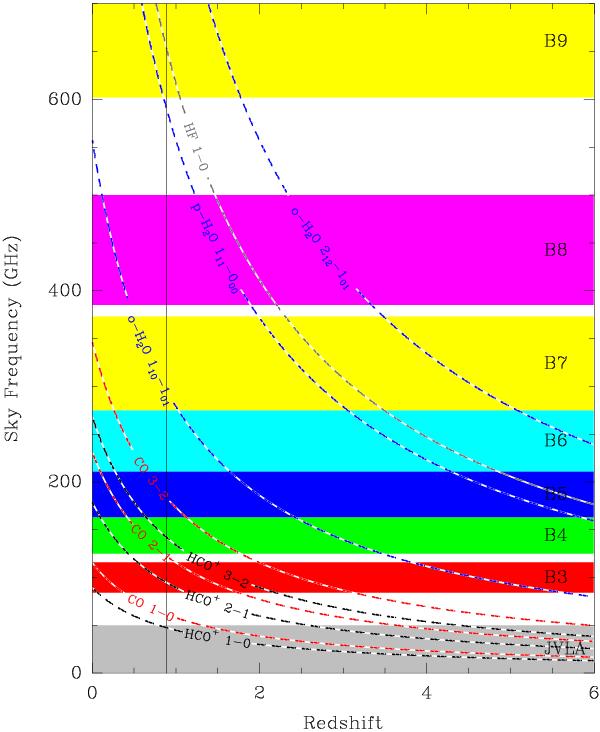
Sky frequency of several tracers of molecular gas (dashed blue: H2O; dotted red: CO; dotted black: HCO+) as a function of redshift, with ALMA bands (labeled B3 to B9) and the Jansky Very Large Array (JVLA) frequency coverage overlaid.
Current usage metrics show cumulative count of Article Views (full-text article views including HTML views, PDF and ePub downloads, according to the available data) and Abstracts Views on Vision4Press platform.
Data correspond to usage on the plateform after 2015. The current usage metrics is available 48-96 hours after online publication and is updated daily on week days.
Initial download of the metrics may take a while.