Free Access
Fig. 11
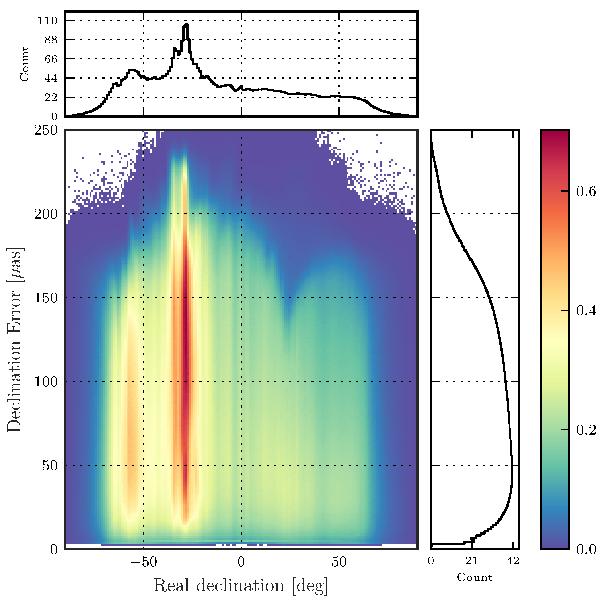
Declination error against real declination. The colour scale is linear, with a factor of 105. Histograms are computed for both declination and declination error. The colour scale represents log density of objects in a bin size of 1 degrees by 5 μas. White area represents zero stars.
Current usage metrics show cumulative count of Article Views (full-text article views including HTML views, PDF and ePub downloads, according to the available data) and Abstracts Views on Vision4Press platform.
Data correspond to usage on the plateform after 2015. The current usage metrics is available 48-96 hours after online publication and is updated daily on week days.
Initial download of the metrics may take a while.