Fig. 3
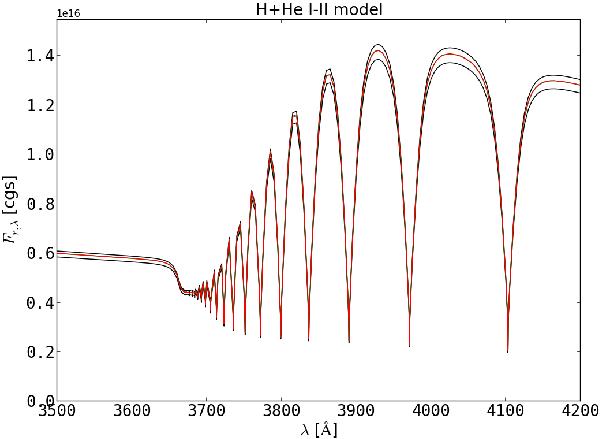
Spectral region near the Balmer jump for our first test with NLTE treatment of H I and He I–II. The red lines show the results of the 1D NLTE calculation whereas the black lines show the maximum and minimum of the radial component of the flux vector over all outermost voxels from the 3D calculation. The spread in the 3D model is due to the finite numerical resolution, see Paper VI.
Current usage metrics show cumulative count of Article Views (full-text article views including HTML views, PDF and ePub downloads, according to the available data) and Abstracts Views on Vision4Press platform.
Data correspond to usage on the plateform after 2015. The current usage metrics is available 48-96 hours after online publication and is updated daily on week days.
Initial download of the metrics may take a while.