Fig. 8
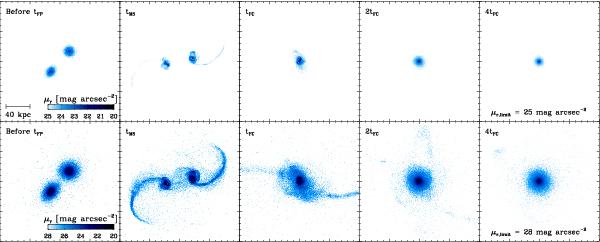
Mock images of the SbSb45h merger (mass ratio is 1:1) viewed perpendicular to the orbital plane of a companion galaxy. Color scheme is surface brightness in the SDSS r band assuming luminosity distance, dL = 100 Mpc. Each row shows a merger process in time sequence: before the first passage time (tFP), the maximum separation time (tMS), and units of the final coalescence time (tFC), from left to right. Each column is plotted with different observation limits: μlimit = 25 mag arcsec-2 (top) and μlimit = 28 mag arcsec-2 (bottom). Background color represents observation limit.
Current usage metrics show cumulative count of Article Views (full-text article views including HTML views, PDF and ePub downloads, according to the available data) and Abstracts Views on Vision4Press platform.
Data correspond to usage on the plateform after 2015. The current usage metrics is available 48-96 hours after online publication and is updated daily on week days.
Initial download of the metrics may take a while.