Fig. 4
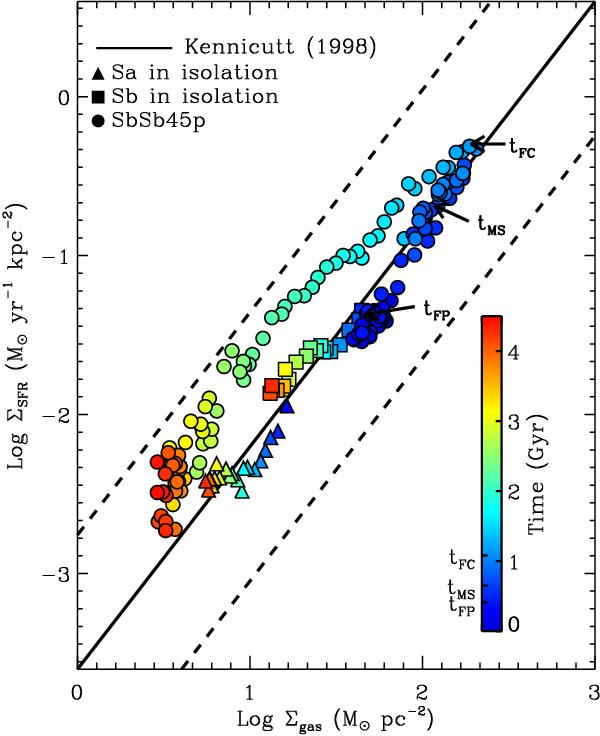
Evolution of star formation surface density vs. gas column density for the Sa model (filled triangle), Sb model (filled square), and SbSb45p merger (filled circle). Each symbol corresponds to the center of a galaxy at 20 and 5 Myr time intervals for each isolated progenitor (Sa and Sb) and the SbSb45p merger. For the SbSb45p merger, the merger timescales associated with star formation are labeled with arrows: i.e., the first passage time (tFP), the maximum separation time (tMS), and the final coalescence time (tFC). The solid line is the best fit given by Kennicutt (1998), and the dashed lines represent a factor of 7 upper/lower bound which covers all observations in the same literature.
Current usage metrics show cumulative count of Article Views (full-text article views including HTML views, PDF and ePub downloads, according to the available data) and Abstracts Views on Vision4Press platform.
Data correspond to usage on the plateform after 2015. The current usage metrics is available 48-96 hours after online publication and is updated daily on week days.
Initial download of the metrics may take a while.