Fig. 15
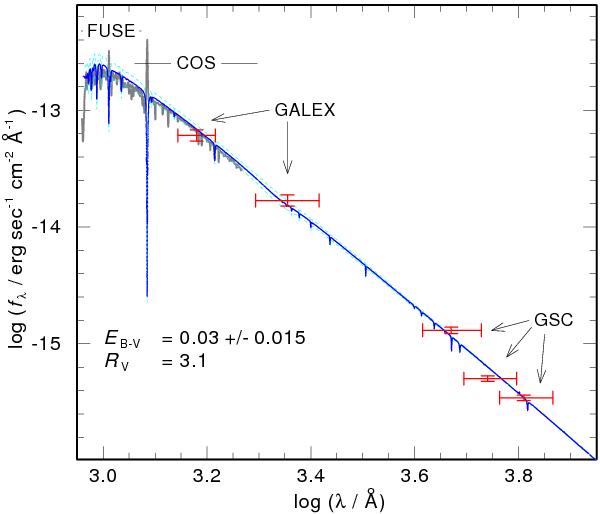
Determination of EB − V for HS 1522+6615. The FUSE and COS spectra and GALEX and BVR brightnesses from the GSC 2.3 catalog are used for comparison. The thick (blue) line is the spectrum of the final photospheric model. The dashed lines indicate the error limits.
Current usage metrics show cumulative count of Article Views (full-text article views including HTML views, PDF and ePub downloads, according to the available data) and Abstracts Views on Vision4Press platform.
Data correspond to usage on the plateform after 2015. The current usage metrics is available 48-96 hours after online publication and is updated daily on week days.
Initial download of the metrics may take a while.