Fig. 14
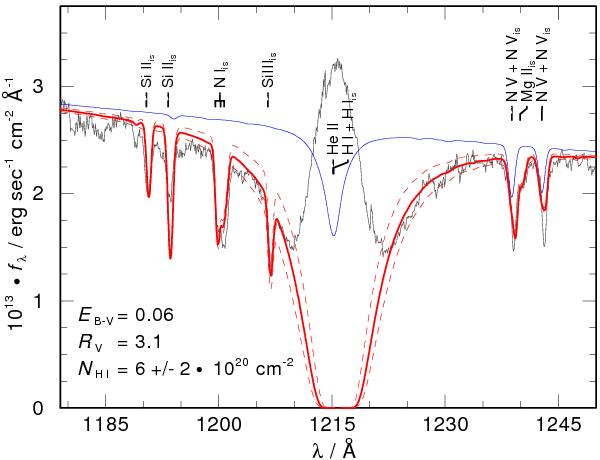
Determination of the interstellar H i column density toward K 1−27. The dashed lines indicate the error limits. The thin (blue) line is the pure photospheric spectrum. Prominent spectral lines are marked at top, “is” indicates interstellar origin. The line center of Ly α is dominated by geocoronal emission.
Current usage metrics show cumulative count of Article Views (full-text article views including HTML views, PDF and ePub downloads, according to the available data) and Abstracts Views on Vision4Press platform.
Data correspond to usage on the plateform after 2015. The current usage metrics is available 48-96 hours after online publication and is updated daily on week days.
Initial download of the metrics may take a while.