Fig. 8
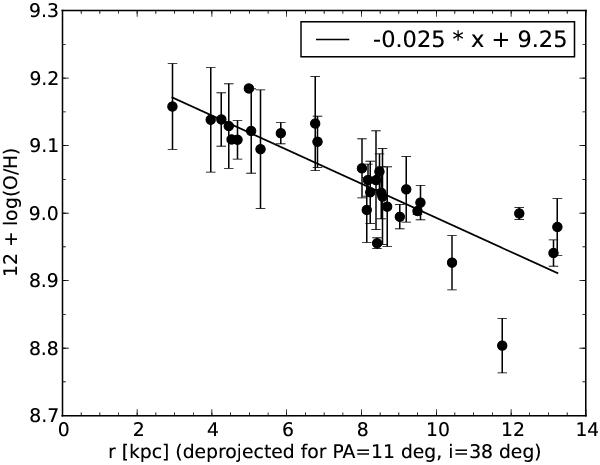
Abundance gradient in NGC 5427. The oxygen abundance (see Fig. 7 and Table 1) is plotted against deprojected distance from the nucleus. Region 35 is left out, as the abundance has a large uncertainty. To compute the deprojected distance, it is assumed that the galaxy disk of NGC 5427 has an inclination of i = 38deg and a position angle of PA = 11deg (cf. Marinova & Jogee 2007). The line shows a linear regression. The linear regression results in a gradient of –0.025 dex/kpc and a (maximum) central abundance of 12 + log (O/H) = 9.25, typical for galaxies in their early tidal interaction phase.
Current usage metrics show cumulative count of Article Views (full-text article views including HTML views, PDF and ePub downloads, according to the available data) and Abstracts Views on Vision4Press platform.
Data correspond to usage on the plateform after 2015. The current usage metrics is available 48-96 hours after online publication and is updated daily on week days.
Initial download of the metrics may take a while.