Fig. 7
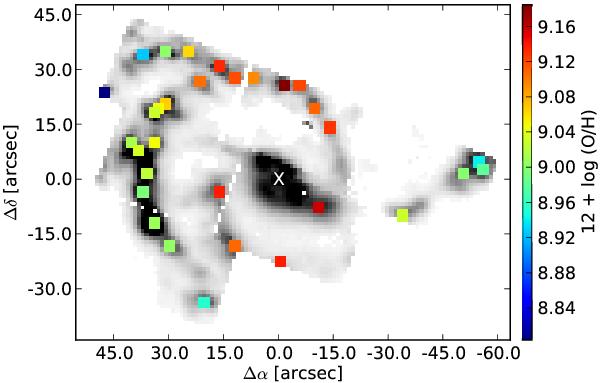
Oxygen abundances in NGC 5427 as derived for H ii region complexes via photoionisation modelling. The oxygen abundance listed in Table 1 is colour-coded. Region 35 is left out, as the abundance has a large uncertainty. The grey-scale background image shows the Hα image in which unreliable measurements have been clipped. The nucleus is marked with a white cross. Note the presence of an abundance gradient with increasing abundance along the spiral arms toward the central region.
Current usage metrics show cumulative count of Article Views (full-text article views including HTML views, PDF and ePub downloads, according to the available data) and Abstracts Views on Vision4Press platform.
Data correspond to usage on the plateform after 2015. The current usage metrics is available 48-96 hours after online publication and is updated daily on week days.
Initial download of the metrics may take a while.