Open Access
Fig. 6
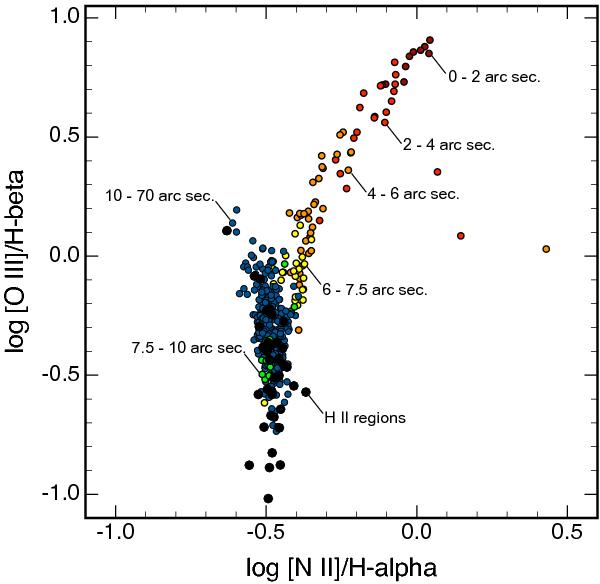
BPT diagram [N ii] λ6584/Hα vs. [O iii] λ5007/Hβ for NGC 5427 plotted for individual spaxels (colour) and for integrated H ii regions (black points). Note how the “composite” spaxels are organised according to their distance from the nucleus (indicated on the figure).
Current usage metrics show cumulative count of Article Views (full-text article views including HTML views, PDF and ePub downloads, according to the available data) and Abstracts Views on Vision4Press platform.
Data correspond to usage on the plateform after 2015. The current usage metrics is available 48-96 hours after online publication and is updated daily on week days.
Initial download of the metrics may take a while.