Fig. 3
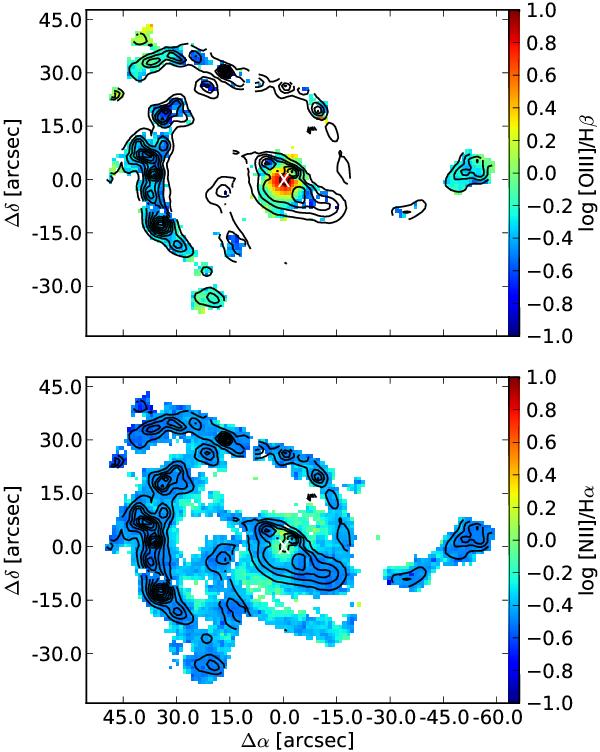
log [O iii]λ5007/Hβ and log [N ii]λ6583/Hα maps of NGC 5427. Also shown are the Hα contours with levels chosen to highlight the main Hα features. The data have been clipped using a signal-to-noise ratio of 5 between the line flux and the standard deviation of the nearby continuum multiplied by the FWHM of the line. Note that near the nucleus, the [N ii]λ6583/Hα ratios are enhanced in the inter-arm regions away from prominent H ii regions.
Current usage metrics show cumulative count of Article Views (full-text article views including HTML views, PDF and ePub downloads, according to the available data) and Abstracts Views on Vision4Press platform.
Data correspond to usage on the plateform after 2015. The current usage metrics is available 48-96 hours after online publication and is updated daily on week days.
Initial download of the metrics may take a while.