Fig. 13
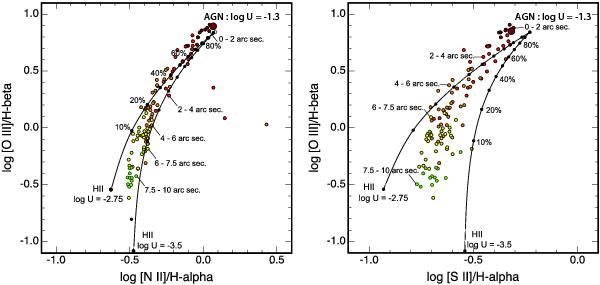
Representative mixing curves for all spaxels classified as “composite” based on their line ratios. The mixing curves are shown in the [N ii]/Hα versus [O iii]/Hβ diagnostic diagram. The observed emission-line ratios are colour-coded based on their de-projected distance from the nucleus. The distance ranges corresponding to the different colours are indicated in the plot. For clarity, only two representative mixing curves are shown. The anchor point for AGN ionisation is defined by log U = −1.1 for the best-fitting model given in Table 2. The two anchor points for photoionisation in H ii regions are defined by log U = −2.75 and log U = −3.5 for an oxygen abundance of 12 + log (O/H) = 9.24.
Current usage metrics show cumulative count of Article Views (full-text article views including HTML views, PDF and ePub downloads, according to the available data) and Abstracts Views on Vision4Press platform.
Data correspond to usage on the plateform after 2015. The current usage metrics is available 48-96 hours after online publication and is updated daily on week days.
Initial download of the metrics may take a while.