Fig. 11
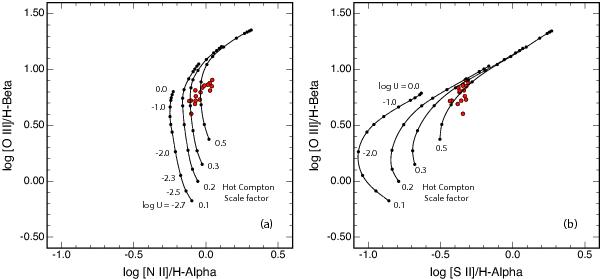
BPT diagrams for the individual spaxels within 2.5 arcsec of the nucleus (red points). We show four sets of models with ionisation parameter in the range  , and with different scaling of the hard X-ray component relative to the accretion disk component (0.1 up to 0.5). Note the degeneracy of the solutions on this diagram; good fits to the nuclear line ratios on a BPT diagram can be obtained with different pairs of U and X-ray scaling factor. However, the excitation of helium breaks this degeneracy; see Fig. 10.
Current usage metrics show cumulative count of Article Views (full-text article views including HTML views, PDF and ePub downloads, according to the available data) and Abstracts Views on Vision4Press platform.
Data correspond to usage on the plateform after 2015. The current usage metrics is available 48-96 hours after online publication and is updated daily on week days.
Initial download of the metrics may take a while.