Fig. 8
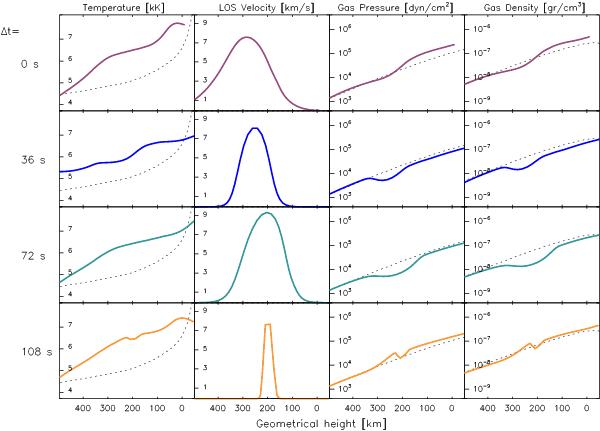
Atmospheric parameters versus geometrical height. There are four columns with temperature, LOS velocity, gas pressure, and density depicted as solid lines. Dashed lines come from the HSRA reference model. The four rows correspond to the different time intervals defined in Fig. 1 with color lines. The geometrical heights from each row are different and come from those shown in Fig. 7.
Current usage metrics show cumulative count of Article Views (full-text article views including HTML views, PDF and ePub downloads, according to the available data) and Abstracts Views on Vision4Press platform.
Data correspond to usage on the plateform after 2015. The current usage metrics is available 48-96 hours after online publication and is updated daily on week days.
Initial download of the metrics may take a while.