Fig. 5
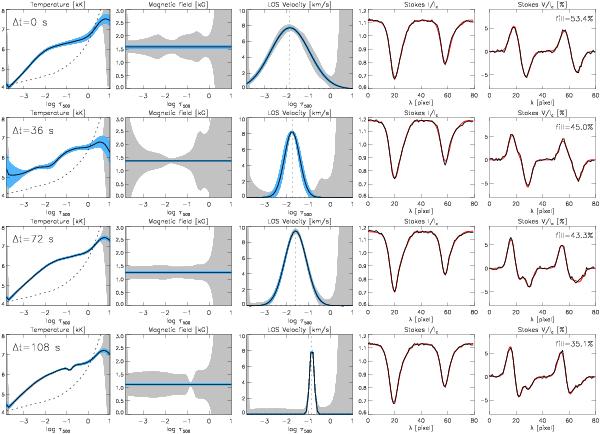
Model atmosphere and Stokes profiles resulting from the SIRGAUSS inversion from one of the detected events. Each row corresponds to a different time running from top to bottom. The Stokes profiles are the same as presented by the color lines in Fig. 1. The first column shows the temperature stratification. Second and third columns are the magnetic field and the LOS velocity stratifications. The black line designates the mean atmosphere obtained from the Monte Carlo simulation, blue is the deviation from this mean solution, and gray represents the nonsensitive regions (large gray regions indicate that the response of the Stokes profiles to perturbations in the model is very weak). The last two columns show the observed Stokes I and V profiles in black and the fitted ones in red. The dashed line in the first column designates the HSRA reference atmosphere temperature, the vertical line in the third column marks the center of the Gaussian perturbation.
Current usage metrics show cumulative count of Article Views (full-text article views including HTML views, PDF and ePub downloads, according to the available data) and Abstracts Views on Vision4Press platform.
Data correspond to usage on the plateform after 2015. The current usage metrics is available 48-96 hours after online publication and is updated daily on week days.
Initial download of the metrics may take a while.