Fig. 3
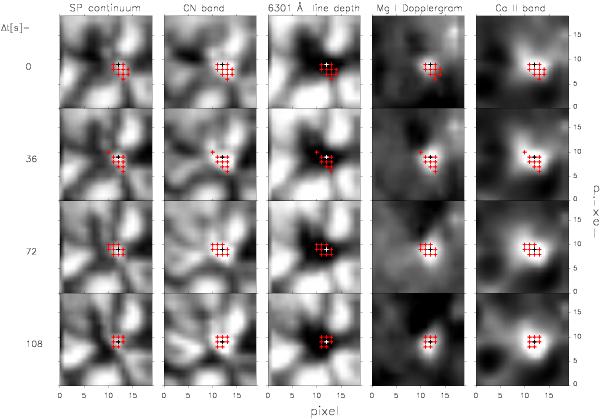
Hinode/SP continuum signal (first column), CN spectral band (second column), line depth of the Fe i 6301.5 Å line (third column), Mg i b2 Dopplergram signal (with downflows in white and upflows in black) (fourth column), and Ca ii h intensity maps (last column). Red crosses correspond to the locations of the pixels that are highly redshifted. The time interval runs from top to bottom and is the same as depicted in color in Fig. 1. The pixel analyzed in that figure is marked with a black cross (white in the third column). We have reduced the spatial resolution of CN, Ca ii h and Mg i b2 images to match the Hinode/SP spatial resolution.
Current usage metrics show cumulative count of Article Views (full-text article views including HTML views, PDF and ePub downloads, according to the available data) and Abstracts Views on Vision4Press platform.
Data correspond to usage on the plateform after 2015. The current usage metrics is available 48-96 hours after online publication and is updated daily on week days.
Initial download of the metrics may take a while.