Fig. 2
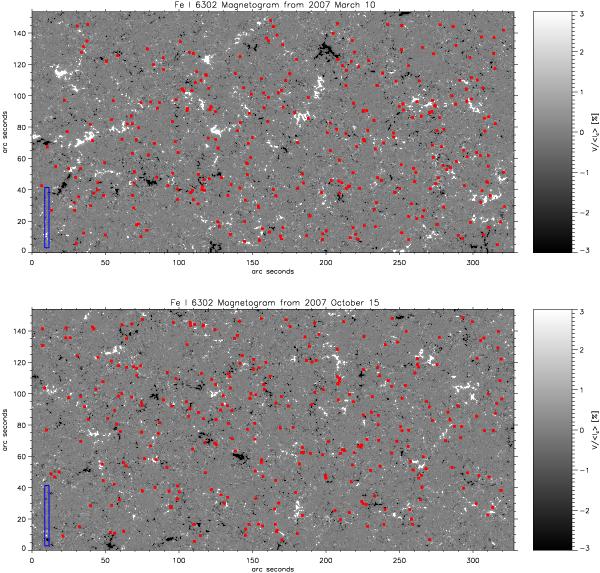
Location of the redshifted events (red filled squares) in the Fe i 6302.5 Å magnetogram from the normal maps recorded on 2007 March 10 (upper panel) and 2007 October 15 (bottom panel). The size of the filled squares is larger than the size of the events to make them visible. The left blue rectangle represents the FOV of the raster scan mode.
Current usage metrics show cumulative count of Article Views (full-text article views including HTML views, PDF and ePub downloads, according to the available data) and Abstracts Views on Vision4Press platform.
Data correspond to usage on the plateform after 2015. The current usage metrics is available 48-96 hours after online publication and is updated daily on week days.
Initial download of the metrics may take a while.