Fig. 13
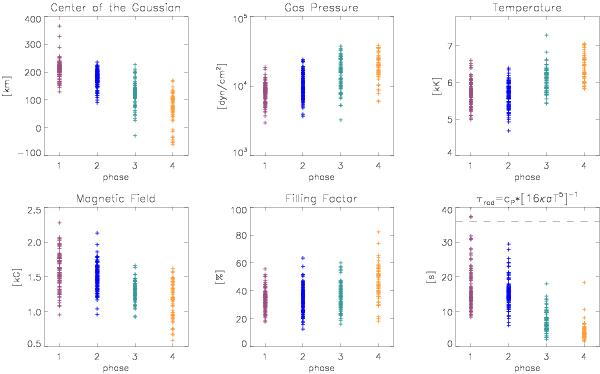
Statistical results for the inversions of a large number of pixels selected from the maps presented in Fig. 2. We have used, in order, 92, 107, 69 and 57 pixels for each different phase presented with different colored lines in Fig. 1. We have kept the same color code for each bump step. The first panel shows the location of the center of the Gaussian perturbation for each phase. The second top panel shows the gas pressure at the center of the Gaussian, and the third top panel displays the temperature at the same location. The first panel of the second row presents the value of the magnetic intensity for each phase. The second bottom panel shows the filling factor of the magnetic component, and the last panel displays the radiative cooling time for each phase.
Current usage metrics show cumulative count of Article Views (full-text article views including HTML views, PDF and ePub downloads, according to the available data) and Abstracts Views on Vision4Press platform.
Data correspond to usage on the plateform after 2015. The current usage metrics is available 48-96 hours after online publication and is updated daily on week days.
Initial download of the metrics may take a while.