Free Access
Fig. 11
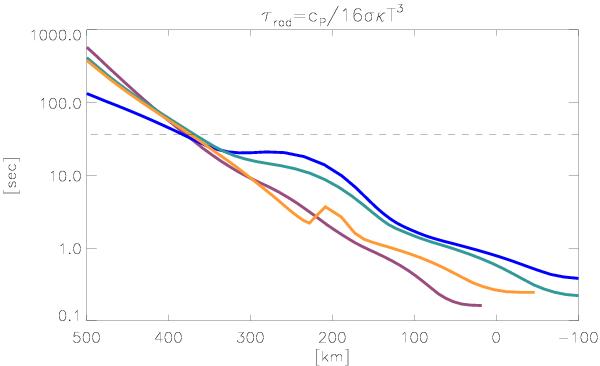
Radiative cooling time for the Gaussian perturbation considering that it is optically thin. There are four colored lines with the same color code as used in Fig. 1. The horizontal line represents the time cadence of the observation.
Current usage metrics show cumulative count of Article Views (full-text article views including HTML views, PDF and ePub downloads, according to the available data) and Abstracts Views on Vision4Press platform.
Data correspond to usage on the plateform after 2015. The current usage metrics is available 48-96 hours after online publication and is updated daily on week days.
Initial download of the metrics may take a while.