Fig. 1
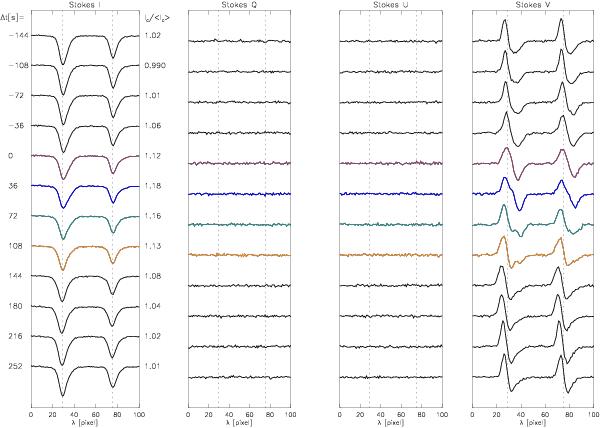
Temporal evolution of a single pixel from one of the 11 detected cases in the SP time series. Each column corresponds to a different Stokes parameter, and time runs from top to bottom. Stokes Q and U amplitudes are always lower than the noise. Stokes V shows a bump at the top-center of the line (purple; Δt = 0) that apparently moves, crossing the center of the line to the red wing (orange; Δt = 108), and finally vanishes. The appearance of the bump coincides with an enhancement of the continuum intensity signal (values at the right of the first column represent the continuum signal divided by the mean continuum intensity of the whole map). After the disappearance of the bump, the continuum intensity decreases.
Current usage metrics show cumulative count of Article Views (full-text article views including HTML views, PDF and ePub downloads, according to the available data) and Abstracts Views on Vision4Press platform.
Data correspond to usage on the plateform after 2015. The current usage metrics is available 48-96 hours after online publication and is updated daily on week days.
Initial download of the metrics may take a while.